Dickinson Summer Seminars on Teaching Physics
Using Interactive Teaching Methods on Computers
Return to Table
of Contents
Previous Page
III. Impact of the ITMC Seminar
Seminar participants reported being very optimistic about
the value of ITMC methods immediately after taking the seminar.
Fully three quarters of those responding to this question
indicated that they were very optimistic, and another
18% indicated being mildly optimistic after taking
the seminar.
Currently, nearly half of all respondents (43) indicate
that they are very optimistic today (48%), while another
30 (33%) report being mildly optimistic. Only 15 respondents
have mixed feelings today (17%). One individual who
left the seminar feeling "very optimistic" reported
being "mildly pessimistic" today. Another individual
who reported being "mildly optimistic" after the
seminar also downgraded to being "mildly pessimistic"
today. At the same time, 39 of the 67 respondents (58%) who
were "very optimistic" immediately after the seminar
remain "very optimistic" today. Four more respondents
who reported being "mildly optimistic" after the
seminar have become "very optimistic" (see
Chart 10)
It would be reasonable to expect that the very high sense
of optimism shared by respondents immediately after the seminar
would attenuate over time. Yet only 31 individuals (34%) reported
feeling less optimistic about ITMC today, while, 59 respondents
(66%) reported feeling just as optimistic or even more optimistic
about ITMC after having experience with this approach in the
field.
Reasons for pessimism: Respondents, as a whole, waxed
eloquently about the value of ITMC in their classrooms. When
asked to state reasons why they were currently not as optimistic
as they might be, quite a few respondents took the opportunity
to indicate that they remain quite convinced of ITMC’s
efficacy. In fact, many of the problems that were identified
had to do with issues quite external to the ITMC approach
itself (e.g., administrative support and funding
problems).
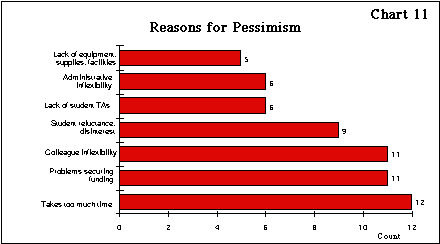
Sources of pessimism identified by respondents are catalogued
in Table 1 and
Chart 11 below. It should be noted that categories
of responses were created to best represent the verbatim responses
of survey participants to an open-ended question which asked
about reasons for pessimism. If one were to
combine, in one category, responses that relate to budgetary
issues -- #1 (lack of equipment), #3 (lack of TAs), and #6
(problems securing funding) -- the magnitude of the funding
problem become more clear. Twenty-two out of a total of 60
responses (37%) would seem related to a lack of
funding.
|
Table 1
Reasons for Pessimism
|
HS
n=14
|
TYC*
n=14
|
BS
n=39
|
MA
n=9
|
PhD
n=15
|
Total
n=91
|
|
1. Lack of equipment, supplies, facilities
|
1 |
1 |
|
|
4 |
5 |
|
2. Administrative inflexibility (especially re: funding
and scheduling)
|
|
2 |
3 |
|
1 |
6 |
| 3. Lack of student assistants |
|
|
4 |
|
2 |
6 |
|
4. Student reluctance, disinterest, disenchantment,
inability
|
1 |
1 |
7 |
|
|
9 |
| 5. Colleague inflexibility |
|
2 |
4 |
1 |
4 |
11 |
| 6. Problems securing funding |
2 |
1 |
6 |
|
2 |
11 |
| 7. Takes too much time |
1 |
2 |
6 |
|
3 |
12 |
| *TYC = Two-Year College |

Lecture habits:
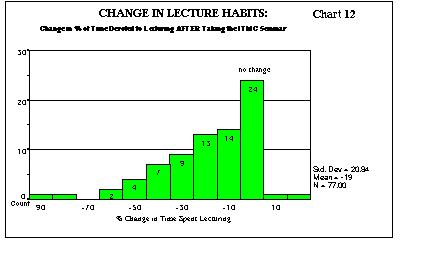
The percentage of time devoted to lecturing is one aspect
of teaching that clearly has changed as a result of being
exposed to the ITMC approach. Twenty-four respondents reported
no change in the amount of time they devote to lecturing (31%),
and two more indicated some increase. Meanwhile, two-thirds
of the respondents reported that they now devote less
time to lecturing (66%) than they did before adopting ITMC.
Overall, the group reported an average drop of 19% in the
amount of time devoted to lecturing. Those who reported a
drop in the percentage of time devoted to lecturing had an
average decrease of 30%, suggesting the de-emphasis on lecturing
that is central to the ITMC approach has had a profound effect
on participant teaching behavior, as a group (see
Chart 12).

Another way to think about this set of data is to consider
the "gain factor." The gain factor in this case
is conceptualized as the percentage decrease in the
amount of class time devoted to lecture. Those who started
out lecturing 90% of the time and dropped to 60% of the time
would have a gain factor of 33 (e.g., a drop of 33%). Similarly,
someone who dropped from lecturing 30% to 20% of the time
would have the same "gain factor" of 33.
gain factor = [(% lecture before ITMC)
- (% lecture after ITMC]/0-% lecture before ITMC
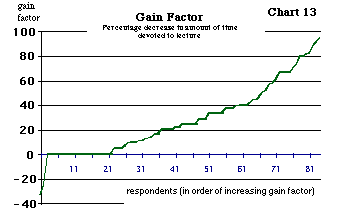
Of the 84 respondents reporting data on both the "before"
and "after" questions related to lecturing, the
average gain factor was 28. That is to say, on average, the
group posted a 28% decrease in the percentage of time devoted
to lecturing. One individual reported increasing the
amount of time devoted to lecturing by 33% (gain= -35) and
another reported increasing the amount of time devoted
to lecturing by 25% (gain= -25). Twenty-four respondents (29%)
reported little or no change, and the remaining 58 respondents
(69%) reported gain factors ranging from 9 (9% decrease in
lecturing) to a maximum of 95 (95% decrease in lecturing).
The standard deviation for the group was 28 (see
Chart 13).

Teaching Activities: The next three charts describe
the kinds of ITMC activities employed in the lecture hall,
in the lab, and when using the workshop approach. With the
exception of video camera analysis, all methods were
used by at least half of the respondents at least sometimes.
Many reported employing these techniques often. This
is especially the case with spreadsheet graphing used
often in labs by 75% of those responding and during
workshop sessions by 56% of those responding. Interfacing
techniques (e.g., MBL, CBL) also appeared to be heavily used,
employed often by 79% of those responding during labs
and by 71% of those responding during workshop sessions.
Not surprisingly, ITMC methods were not as heavily used
during lecture sessions. Still, in almost all cases, all of
these techniques are employed at least sometimes by
at least half of those responding (see
Charts 14 and
15).
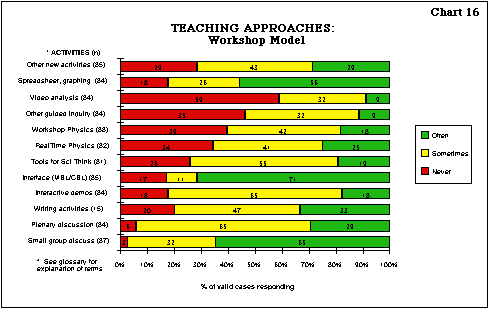
Most respondents opted to respond to this question by
explaining their activity in lectures and labs, separately.
About one-third of the respondents chose to categorize themselves
as using the "Workshop Model." The "Workshop
Model" was not defined, but this option was provided
to address cases where respondents use one "hybrid"
class session for teaching physics rather than the more traditional
approach, where classroom lecturing and laboratory activities
are conducted separately (see Chart 16).

Other Teaching Innovations: In addition to the teaching
methods catalogued in the charts above, a number of other
innovations were reported as useful in implementing ITMC.
Activities developed by Eric Mazur (Harvard) were employed
by eight respondents, while eight more respondents reported
developing their own activities. One respondent at a Ph.D.-granting
institution reported using Physics Theater: a series
of movement studies developed for large lectures that were
reported to be quite popular with students.
A wide variety of other innovations were mentioned, and
are listed in the table below. The items in the first row
were mentioned twice, each. All other items were mentioned
once (see Table 2).
| Table 2: Other Teaching Innovations |
| McDermott Electric Circuit activities (2) |
Dykstra’s Optics activities (2) |
Curve fitting (2) |
| Socratic dialogue |
MBL optics interfaces; trampoline interfaces |
STELLA |
| ALPS |
Ranking tasks |
Simulations |
| PASCO Scientific Workshop labs |
CPU project (SDSU) |
ClassTalk-like activities |
| Hovercraft in the classroom |
modified PBI |
Thornton’s Visualizer |
| Boord Digital Timer-Frequency meter |
Prisms project |
Karpus/Lawrence Hall of Science Learning Cycles |
| EM field activities |
Modeling Workshop |
Interactive Physics |
| Interactive world wide web activities |
Thin, flexible plastic tubing w/ colored
water used as a manometer for PVT activities
|
Phase changes of sound pulses reflected
at open/closed ends of PVS pipe
|
| Modeling Physics |
Media max: Physics Cinema Classics (PCC) |
Interactive Lecture Demonstrations (ILDs) |
| EF Hockey activities |
Graphs and Tracks |
Chabay and Sherwood activities |
| Small group discussions |
Model Rocketry interfaces |
Virtual Reality simulations |
| Puzzle method |
Case Studies |
Learning problems/programs |
Return to Table
of Contents
Next Page
|

