Dickinson Summer Seminars on Teaching Physics
Using Interactive Teaching Methods on Computers
Return to Table
of Contents
Previous Page
IV. Students
Number of students reached using ITMC methods: The
average respondent reported teaching a total of about 600
students using ITMC methods, for a total sum of 50,000+ students
taught using ITMC, overall (n=83).
(83 respondents) * (600 students taught per
respondent)
= 50,000 students taught by seminar
respondents
Since many of those who did not respond were still completing
graduate school or have since retired, it is unlikely that
these individuals would have had the same sort of impact on
the number of students taught as those who responded. Others
may not have responded because they had drifted away from
ITMC and did not find the survey relevant to their current
teaching. These groups would likely report much lower numbers
of students reached if they had responded.
At the same time, a significant minority, about one-third
of all those who did not respond, simply could not be reached
(e.g., mail returned to sender). It seems reasonable to assume
that these individuals -- if they could be reached -- would
report average numbers somewhere in the middle, between the
average of 600 for those responding and the presumed low average
for those not responding with cause. If we assume the non-responding
group, as a whole, reached only one-third the number of students
on average that the responding group did (200 students for
the non-responding group vs. 600 students for the responding
group), one could then speculate that the non-responding group
reached approximately 34,000 students.
(253 total participants - 83 respondents for
this question) * (200 students per non-respondent)
= 34,000 students taught by
non-respondents
Therefore, overall, we can estimate that approximately
84,000 students have learned physics in courses taught by
seminar alumni, using ITMC techniques.
50,000 reported by the responding group (n-83)
+ 34,000 estimated for the non-responding group
(n=170)
= 84,000 students taught ITMC between 1990 and
1997
Seminar participants took the ITMC seminars anywhere
between one and six years ago. If we assume that, on average,
seminar participants have been teaching 3 years since taking
the seminar, it would follow that each seminar participant
teaches about 120 students a year using ITMC
84,000 students taught/(235 participants * 3 years of
teaching)
= 120 students per participant per
year
Now, with the summer seminar class of ‘97 added
in, there are a total of about 290 seminar alumni. If we assume
an annual ITMC mortality rate of 15% (e.g., due to deaths,
retirements, and those who drift away from ITMC), that means
there are about 250 seminar alums teaching approximately 120
students a year, or about 30,000 new students per year being
taught physics using ITMC approaches. If current trends hold,
each successive class of approximately 60 seminar participants
will add another 7,000 students a year to the current annual
ITMC teaching load of 30,000 students.
250 alumni * 120 students per alumni per year
= 30,000 new students per year
60 new alumni * 120 students per alumni
= 7,000 students added to the yearly total
each year the seminar is taught
Another way to assess the impact of future seminars is
to estimate the number of students each seminar participant
is likely to teach using ITMC methods over the course of a
career. Assuming that new Ph.D.s are typically about 28 years
old when they begin teaching college physics full time (obviously,
this age will be lower for those who teach high school), and
given that the average years of experience reported by respondents
was 19, we might conclude that the typical respondent is in
his or her mid-forties, with at least 15 years of teaching
to come (even when allowing for sabbaticals). If, on average,
each seminar participant teaches 120 students per year for
fifteen years, approximately 1800 students would be taught
ITMC physics over the course of a typical seminar participant’s
career.
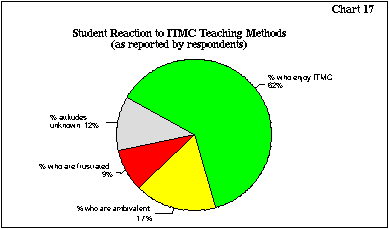
Student reactions to ITMC: Respondents report that
nearly two-thirds of their students enjoy the ITMC approach
(62%), while one in six seem to be ambivalent (17%). A slim
percentage find the approach frustrating (9%; see
Chart 17).
Sometimes there are students among this slim minority who
are especially vocal about their frustrations, poisoning the
well for others in the class, perhaps. This issue will be
addressed later, in the recommendations section.

While the pie chart, above, aggregates responses, the
area chart, below, specifies respondent perceptions of student
reactions case-by-case. There does not seem to be any pattern
beyond the obvious, overwhelming perception that, overall,
most students enjoy ITMC. Four respondents report being entirely
unclear about student perceptions (5%), and 14 more respondents
felt that less than a majority of their students seemed to
enjoy the ITMC approach (17%). The percentage of students
perceived to be enjoying ITMC crosses the 50% line after only
18 cases and steps steadily upward to 100% thereafter. Only
one respondent in 84 reported that a majority of students
were frustrated with ITMC (see Chart 18).
Student learning: Respondents report that half of
all students seem to strengthen their conceptual understanding
when ITMC approaches are used. About one-quarter of all students
seemed to be unaffected by the approach, while a very slim
percentage (5%) seemed to do worse.
Once again, the pie chart (below) aggregates responses,
and the area chart below it specifies respondent perceptions
on a case-by-case basis. There is not quite as much "good
news" here (green = students do better conceptually)
as there was in the pie and area charts on perceptions of
student attitudes above (green = students enjoy ITMC).
At the same time, there is much less "bad news"
reported here (red = students do worse conceptually)
than there was in the pie and area charts on perceptions of
student attitudes above (red = students frustrated
with ITMC). Moreover, the bad news is distributed more evenly
across the cases.
Ten respondents reported that they could not assess student
conceptual understanding (13%) and one respondent indicated
that there was no improvement (this respondent indicated that
everyone stayed about the same). Twenty more reported
that less than half their classes did better (26%) with most
of the rest of the students taught by these respondents falling
in the about the same or unknown impact categories.
The remaining 47 respondents indicated that at least half
the class learned more (60%), and 33 reported that 70% or
more of the class did better (42%).
Overall, Chart 19 suggests that ITMC methods have either
a positive impact on student learning (50%), or at least do
no harm (26% ) when it comes to the conceptual understanding
that students achieve. The smaller gray area -- indicating
impact unknown suggests that perhaps teachers and instructors
of physics need better tools or more practice with tools designed
to assess the conceptual understanding that students obtain,
regardless of the methods used.
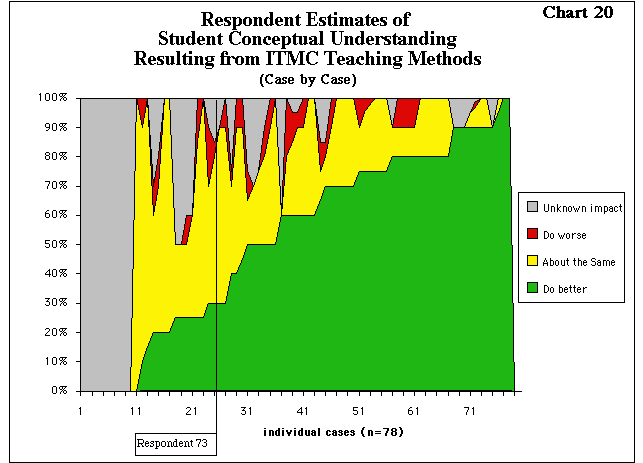
It should be noted that student frustration does not
always mean that students do not learn more using ITMC. Even
Respondent 73, the individual referred to above who reported
a high degree (70%) of student frustration,
went on to report that 30% of his students actually did better,
conceptually, with ITMC, with 50% performing at about the
same level. This respondent reported that only 5% did worse.
(Respondent 73 put the remainder -- 15% -- in the unknown
category; see Chart 20).
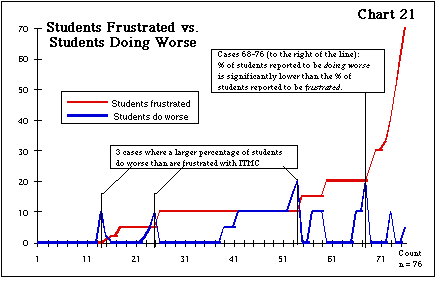
In fact, when plotting students frustrated against
students do worse, it becomes clear that the vast majority
of students who ARE frustrated with ITMC do NOT, in fact,
do worse conceptually with this teaching method. The blue
students do worse line spikes above the students
frustrated line in only three cases (4% of valid cases:
see chart below). The percentage of students reported to be
frustrated with ITMC is matched by the percentage of students
reported to be doing worse in another 13 cases (17%). In the
remaining 57 cases in which some frustration was reported,
the percentage of students reported to be doing worse was
lower, in many cases significantly lower (e.g., see cases
68-76 in the chart, below), than the percentage of students
reported to be frustrated. Seminar participants might be forewarned
about this phenomenon; that student frustrations that become
manifest as the course unfolds do NOT necessarily translate
into poor performance after the course has been completed
(see Chart 21).


Teaching Assessment: Teachers assessed student performance
in a number of ways, most often through traditional multiple
choice (40) and essay question (40) exams. Quite a few also
employed the Force and Motion Conceptual Evaluation (FMCE)
and the Force Concept Inventory (FCI) as well (see
Chart 22).
Techniques Used in Student Assessment
Teaching Elaboration: A wide variety of responses
were elicited in answer to the open-ended question dealing
with the value of ITMC in the classroom. (Question 14.3 of
the survey: Could you comment on the "nature" of the learning
students experience using ITMC, versus the nature of the learning
using more traditional approaches). One
high school teacher indicated the ITMC prevented students
from "hiding behind the equation" while another
argued that ITMC was preferable because it was "more
concrete, more real life to the students, active learning
-- hands and minds in motion." A professor at a two-year
college indicated that ITMC makes it possible for students
to:
"own" the knowledge at
a very fundamental level. The ITMC [approach] reinforces
actual learning as opposed to rote memorization, evidenced
in the ability to solve problems. Students are better
able to grasp physical situations and "see"
these situations in their "mind’s eye."
I have observed that students have a greater flexibility
in negotiating the links between the written word, the
actual physical situation and the mathematical tools useful
for describing these physical situations.
The benefits of ITMC in teaching physics,
reported by respondents of this survey, are catalogued in
Table 3 below.
|
Table 3:
The Nature of ITMC Learning
|
HS
n=14
|
AS
n=14
|
BS
n=39
|
MA
n=9
|
PhD
n=15
|
Total
n=91
|
| Learning skills; Problem solving |
|
2 |
1 |
|
|
3 |
|
Observational Techniques; Scientific methodology;
Technical skills
|
2 |
|
1 |
|
1 |
4 |
|
Can be very time-consuming (squeezing out some
substance)
|
1 |
|
1 |
1 |
1 |
4 |
| Changes beliefs; Creates flexibility |
1 |
1 |
2 |
|
|
4 |
| Enhances critical thinking; Intuition |
|
2 |
2 |
1 |
|
5 |
|
Active participation; Hands-on Involvement
|
3 |
|
2 |
1 |
1 |
7 |
| Interesting; Enjoyable; Natural |
1 |
1 |
5 |
|
|
7 |
|
Experiential; Concrete; Real-life; Applied
|
3 |
1 |
2 |
|
1 |
7 |
| Collaborative; Discussions stimulated |
2 |
1 |
1 |
2 |
3 |
9 |
| Permanent; Confidence; Ownership |
2 |
2 |
3 |
1 |
2 |
10 |
|
Understanding (vs. memorizing); Conceptual mastery
|
1 |
4 |
6 |
5 |
2 |
18 |
Return to Table
of Contents
Next Page
|

