Teacher/Faculty Surveys
Instrument 14: Teacher Survey For Grades K-8 Science
Project: Surveys of Enacted Curriculum
Council of Chief State School Officers
Funding Source: NSF: EHR
Purpose: To provide education policymakers, administrators, and teachers with comparative information on math and science instruction
Administered To: K-8 teachers whose school districts are participating in the Mathematics and Science Partnership Program
Topics Covered:
- Demographics (Student): gender, ethnicity, language spoken
- Implementation Activities: content, method, activities, curriculum/materials, equipment/technology, professional development activities
- Institutional Context: length of school year
- Learning Environment/Classroom: class size, classroom organization, number of instructional hours
- Lesson/Curriculum Plan: learning environment, methods, content, activities
Format/Length: 901 closed-ended items
Council of Chief State School Officers
Wisconsin Center for Education Research
SURVEYS OF ENACTED CURRICULUM
Teacher Survey
For
Grades K-8
Science
Thank you for agreeing to participate in this survey on science and mathematics instruction. The enclosed survey is part of a collaborative effort to provide education policymakers, administrators, and most importantly, teachers like yourself with comparative information about mathematics and science instruction in districts participating in the Mathematics and Science Partnership Program. To learn more about the surveys of enacted curriculum and their use in other projects, please visit the project website; http://www.ccsso.org/sec.html
Your participation in this survey is voluntary. If you choose to participate, all of your responses will be kept confidential. No one outside of the research team will have access to your responses, nor will any individual responses be shared with staff in your school, district or state. No individuals will be identified in any of the reports. The questionnaire poses no risk to you and there is no penalty for refusal to participate. You may withdraw from the study simply by returning the questionnaire without completing it, without penalty or loss of services or benefits to which you would be otherwise entitled.
If you have any questions regarding your rights as a research participant, please contact the University of Wisconsin-Madison School of Education's Human Subjects Committee office at (608) 262-2463.
A joint project of the Council of Chief State School Officers, the American Institutes for Research and the Wisconsin Center for
Education Research, with funding support from the National Science Foundation.
The following pages request information regarding students in the target Science class for the 2002-2003 school year (last school year).
Please read each question and the possible responses carefully, and then mark your response by filling in the appropriate circle in the response section. A pen or pencil may be used to complete the survey.
| 4 |
Indicate the grade level of the majority of students in the target class. |

K |

1 |

2 |

3 |

4 |

5 |

6 |

7 |

8 |

9 |

10 |

11 |

12 |
| |
|
|
|
|
|
|
|
|
|
|
|
|
|
|
| 5 |
How many students are in the target class? |
|
 |
10 or less |
|
|
 |
21 to 25 |
| |
|
 |
11 to 15 |
|
|
 |
26 to 30 |
| |
|
 |
16 to 20 |
|
|
 |
31 or more |
| |
|
|
|
|
|
|
|
|
|
|
|
|
|
|
| 6 |
What percentage of the students in the target class are female? (Estimate to the nearest ten percent.) |
|
|
|
|
|
|
|
|
|
|
|
 |
|
| |
Less than 10 |
10 |
20 |
30 |
40 |
50 |
60 |
70 |
80 |
90+ % |
| |
|
|
|
|
|
|
|
|
|
|
|
|
|
|
| 7 |
What percentage of the students in the target class are not Caucasian? (Estimate to the nearest ten percent.) |
|
|
|
|
|
|
|
|
|
|
|
 |
|
| |
Less than 10 |
10 |
20 |
30 |
40 |
50 |
60 |
70 |
80 |
90+ % |
| |
|
|
|
|
|
|
|
|
|
|
|
|
|
|
| 8 |
During a typical week, approximately how many hours will the target class spend in Science instruction? |
|
 |
 |
 |
 |
 |
 |
 |
 |
 |
 |
|
|
(Number of instructional hours) |
|
|
| |
|
|
|
|
|
|
|
|
|
|
|
|
|
|
| 9 |
What is the average length of each class period for this targeted Science class? |
|
 |
Not applicable |
 |
51 to 60 minutes |
 |
30 to 40 minutes |
 |
61 to 90 minutes |
 |
41 to 50 minutes |
 |
91 to 120 minutes |
 |
Varies due to block scheduling or integrated instruction |
|
|
|
|
|
|
| |
|
|
|
|
|
|
|
|
|
|
|
|
|
|
| 10 |
How many weeks total will the target Science class/course meet for this school year? |
|
|
|
|
Total # weeks = |
1 to 12 |
13 to 24 |
25 to 36 |
| |
|
|
|
|
|
|
|
|
|
|
|
|
|
|
| 11 |
Estimate the achievement level of the majority of students in the target class, based on national standards. |
|
 |
High Achievement Levels |
|
|
|
 |
Average Achievement Levels |
 |
Low Achievement Levels |
 |
Mixed Levels of Achievement |
| |
|
|
|
|
|
|
|
|
|
|
|
|
|
|
| 12 |
What percentage of students in the target class are Limited English Proficient (LEP)? (Estimate to the nearest ten percent.) |
|
|
|
|
|
|
|
|
|
|
|
 |
|
| |
Less than 10 |
10 |
20 |
30 |
40 |
50 |
60 |
70 |
80 |
90+ % |
| |
|
|
|
|
|
|
|
|
|
|
|
|
|
|
| 13 |
What is considered most in scheduling students into this class? |
|
 |
Ability or Achievement |
 |
Parent Request |
 |
Limited English Proficiency |
 |
No one factor more than another |
 |
Teacher Recommendation |
 |
Student selects |
| |
|
|
|
|
|
|
|
|
|
|
|
|
|
|
| |
|
|
|
|
|
|
|
|
|
|
|
|
|
|
Please read the instructions on the next two pages carefully before proceeding.
|
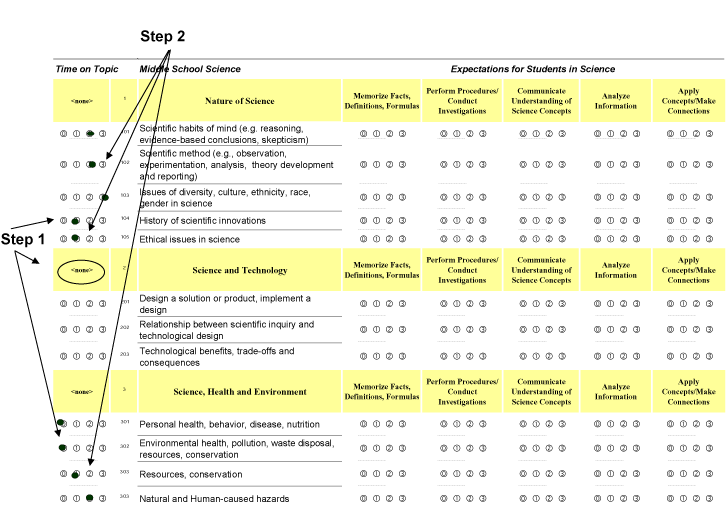
Step 1; Indicate topics not covered in this class.
Begin by reviewing the entire list of topics identified in the topics column of
each table, noting how topics are grouped. After reviewing each topic within a given
grouping, if none of the topics listed within that group receive any instructional coverage,
circle the "<none>" in the "Time on Topic" column for that group. For any individual topic
which is not covered in this science class, fill in the circled "zero" in the "Time on Topic"
column. (Not necessary for those groups with "<none>" circled.) Any topics or topic groups
so identified will not require further response. [Note, for example, that the class
described in the example below did not cover any topics under "Science and Technology"
and so "<none>" is circled.]
Step 2; Indicate amount of time spent on each topic covered in this class.
Examine the list of topics a second time. This time note the amount of coverage
devoted to each topic by filling in the appropriately numbered circle in the "Time on Topic"
column, based upon the following codes:
| |
0 = None, not covered |
|
| |
1 = Slight coverage |
(less than one class/lesson) |
| |
2 = Moderate coverage |
(one to five classes/lessons) |
| |
3 = Sustained coverage |
(more than five classes/lessons) |
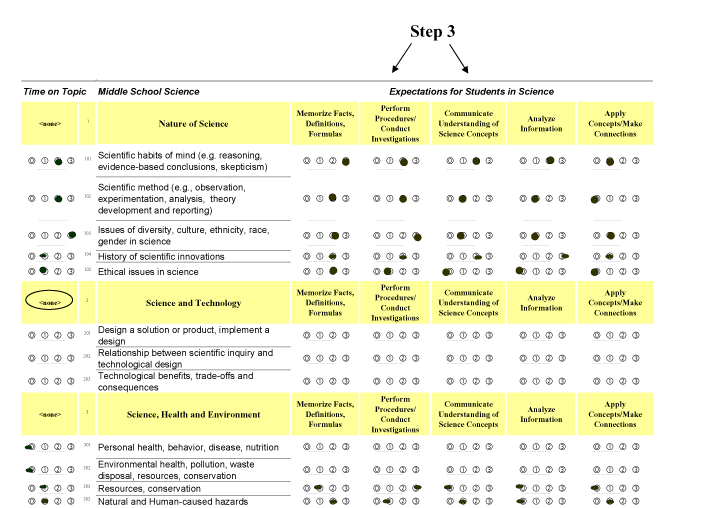
Step 3; Indicate relative emphases of each student expectation for every topic taught.
The final step in completing this section of the survey concerns your expectations
for what students should know and be able to do. For each topic area, please provide
information about the relative amount of instructional time spent on work designed to help
students reach each of the listed expectations by filling in the appropriately numbered
circle using the response codes listed below. (Note: To the left of each content sheet
you will find a list of descriptors for each of the five expectations for students.)
| |
0 = No emphasis |
(Not an expectation for this topic.) |
| |
1 = Slight emphasis |
(Accounts for less than 25% of the time spent on this topic.) |
| |
2 = Moderate emphasis |
(Accounts for 25% to 33% of the time spent on this topic.) |
| |
3 = Sustained emphasis |
(Accounts for more than 33% of the time spent on this topic.) |
| |
|
|
Note: |
A code of "3" should typically be given for only one,
and no more than two expectation categories within any given topic. No expectation
codes should be filled-in for those topics for which no coverage is provided
(i.e., circled "0" or "<none>"). |
Council of Chief State School Officers
Wisconsin Center
for Education Research
Instructional Content
For
Grades K-8
Science
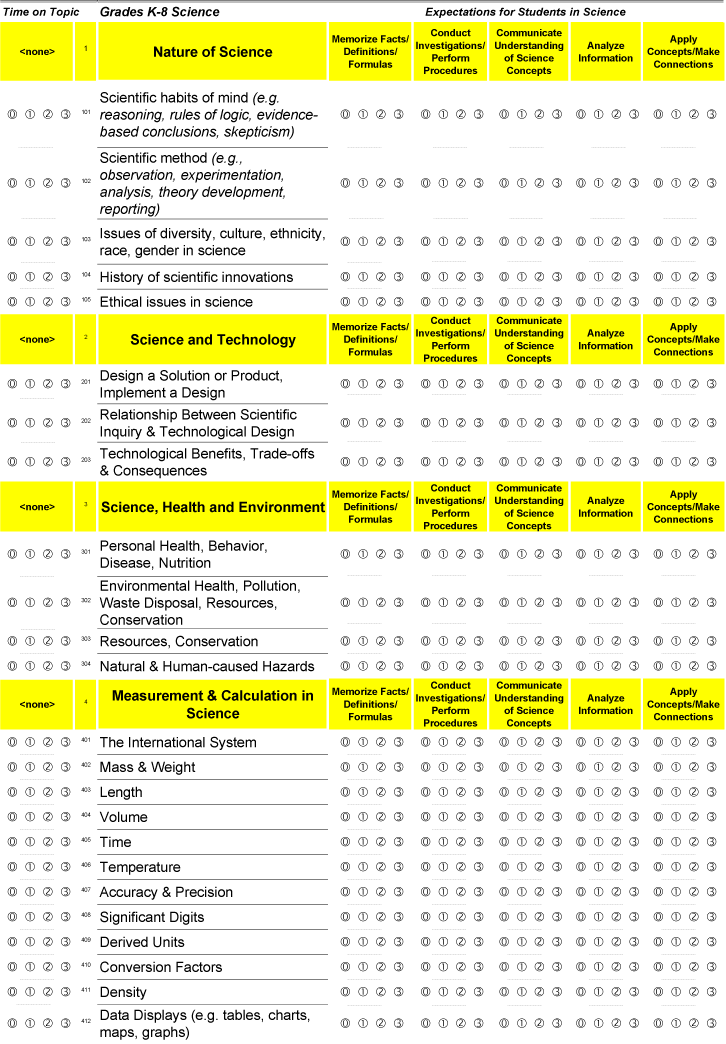
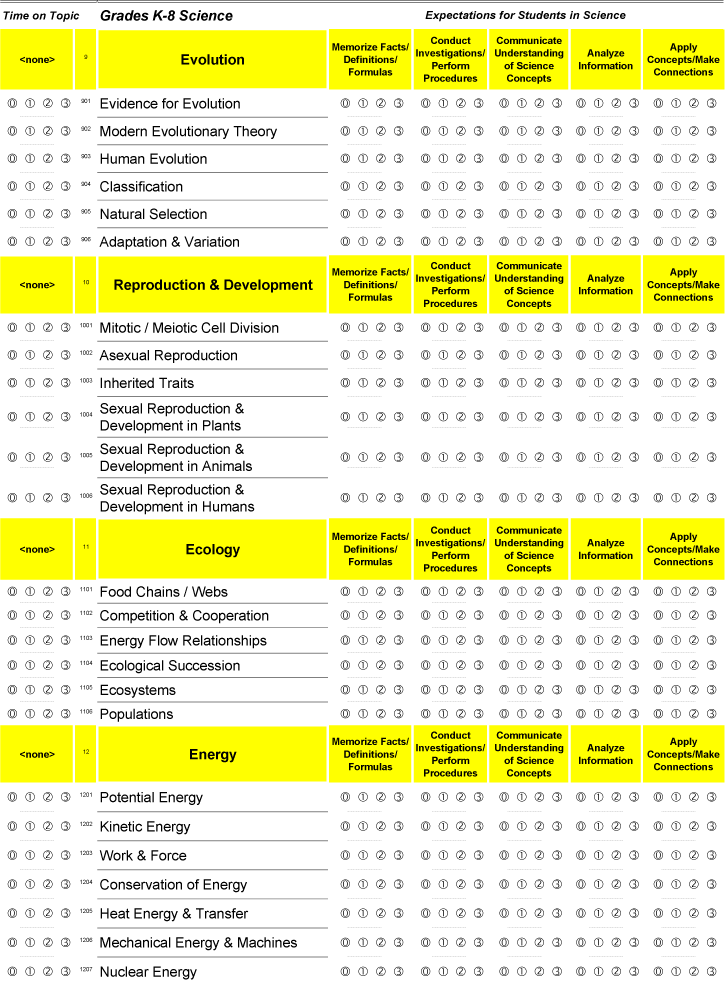
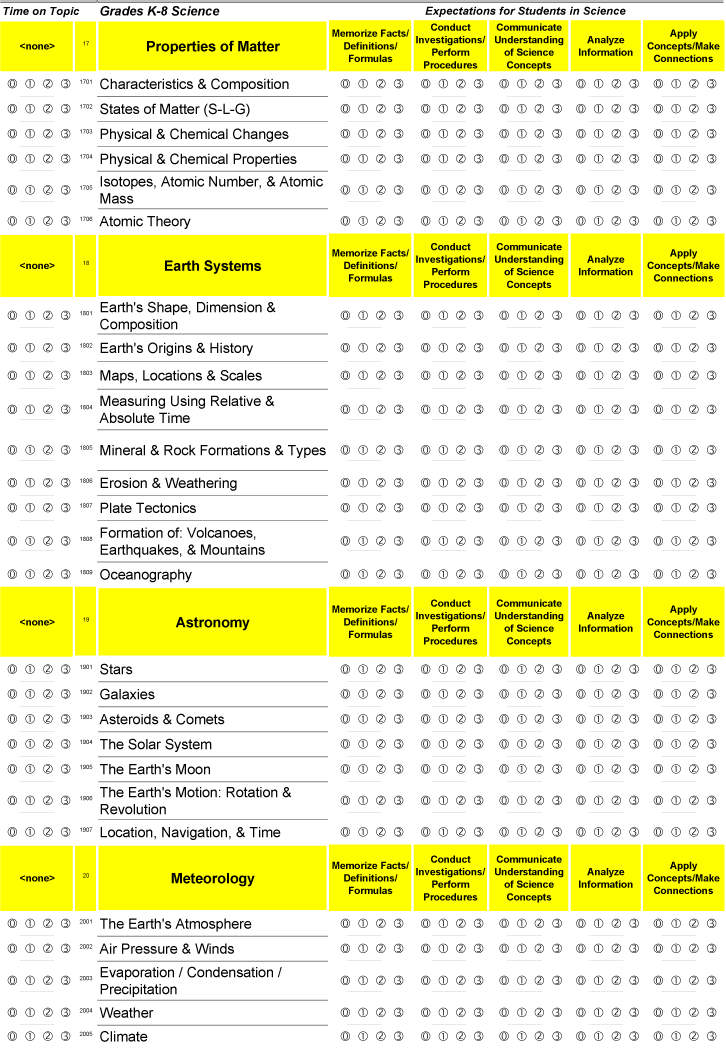
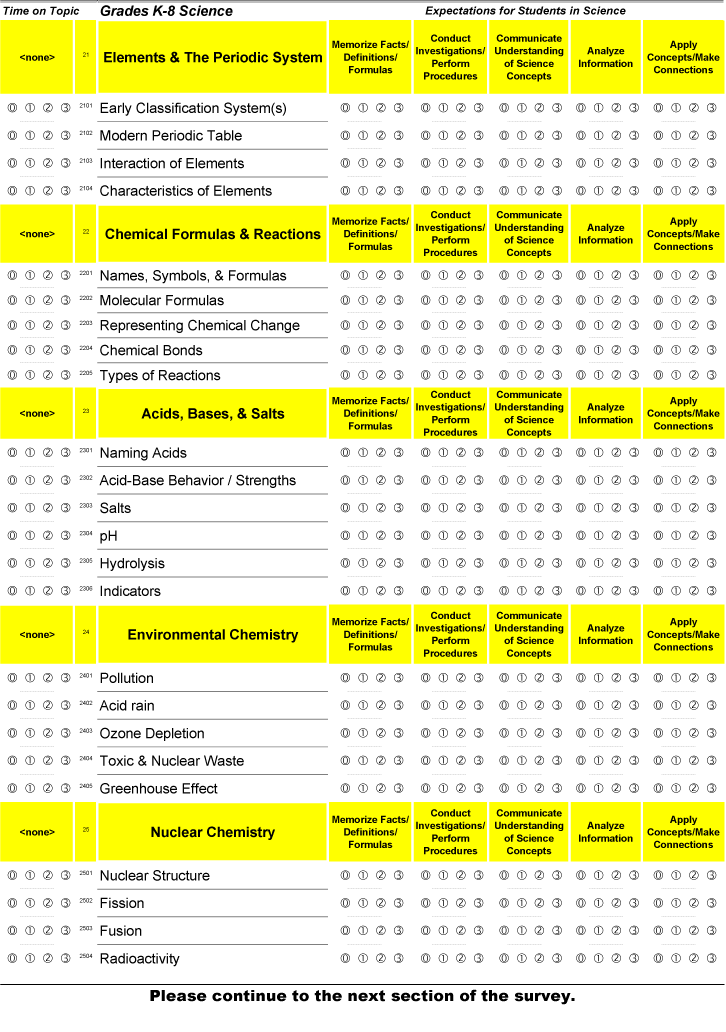
The content matrix that follows contains lists of discrete topics associated with
Science instruction. The categories and the level of specificity are intended to gather
information about content across a wide variety of programs. It is not intended to
reflect any recommended or prescribed content for the grade level and may or may not be
reflective of your local curriculum. The following pages request information
regarding topic coverage and your expectations for students in the target Science class
for the 2002-2003 school year (last school year).
Step 1: Indicate topics not covered in this class
Begin by reviewing the entire list of topics identified in the topics column of
each table, noting how topics are grouped. After reviewing each topic within a given
grouping, if none of the topics listed within that group receive any instructional coverage,
circle the "<none>" in the "Time on Topic" column for that group. For any individual topic
which is not covered in this Science class, fill in the circled "zero" in the "Time on Topic"
column. (Not necessary for those groups with "<none>" circled.) Any topics or topic group
so identified will not require further response. [Note, for example, that the class
described in the example below did not cover any topics under "Instructional Technology"
and so "<none>" is circled.]
Step 2: Indicate the amount of time spent on each topic covered in this class
Examine the list of topics a second time. This time note the amount of coverage
devoted to each topic by filling in the appropriately numbered circle in the "Time on Topic"
column based upon the following codes:
| |
0 = None, not covered |
|
| |
1 = Slight coverage |
(less than one class/lesson) |
| |
2 = Moderate coverage |
(one to five classes/lessons) |
| |
3 = Sustained coverage |
(more than five classes/lessons) |
Step 3: Indicate relative emphasis of each student expectation for every topic taught
The final step in completing this section of the survey concerns your expectations
for what students should know and be able to do. For each topic area, please provide
information about the relative amount of instructional time spent on work designed to help
students reach each of the listed expectations by filling in the appropriately numbered
circle using the response codes listed below. (Note: To the left of each content sheet,
you will find a list of descriptors for each of the five expectations for students.)
| |
0 = No emphasis |
(Not an expectation for this topic.) |
| |
1 = Slight emphasis |
(Accounts for less than 25% of the time spent on this topic.) |
| |
2 = Moderate emphasis |
(Accounts for 25% to 33% of the time spent on this topic.) |
| |
3 = Sustained emphasis |
(Accounts for more than 33% of the time spent on this topic.) |
| |
|
|
Note: |
A code of "3" should typically be given for only one,
and no more than two expectation categories within any given topic. No expectation
codes should be filled-in for those topics for which no coverage is provided
(i.e., circled "0" or "<none>"). |

Expectations for Students in Science
| |
|
|
|
Memorize Facts/ Definitions/
Formulas
|
Communicate Understanding of
Science Concepts
|
| |
Recite basic science facts
Recall science terms and definitions
Recall scientific formula
|
|
Explain concepts
Observe and explain teacher demonstrations
Explain procedures and methods of science and inquiry
Organize and display data in tables or charts
|
Conduct Investigations/
Perform Procedures
|
Analyze Information
|
| |
Make observations
Collect and record data
Use appropriate tools
Make measurements, do computations
Execute procedures
Generate questions, make predictions
Plan and design experiments
Test effects of different variables
|
|
Classify and compare data
Analyze data, recognize patterns
Infer from data
Draw conclusions
|
Apply Concepts/Make Connections
|
| |
Use and integrate science concepts
Apply and adapt science information to real-world situations
Build or revise theory
Apply science ideas outside the context of science
|
| |
|
|
|
Response Codes
Time on Topic
|
Response Codes
Expectations for Students
|
| |
0 = |
None
(Not Covered) |
|
0 = |
No emphasis
(Not a performance goal for this topic) |
| |
1 = |
Slight coverage
(Less than one class/lesson) |
|
1 = |
Slight emphasis
(Less than 25% of time on this topic) |
| |
2 = |
Moderate coverage
(One to five classes/lessons) |
|
2 = |
Moderate emphasis
(25% to 33% of time on this topic) |
| |
3 = |
Sustained coverage
(More than five classes/lessons) |
|
3 = |
Sustained emphasis
(More than 33% of time on this topic) |
| |
|
|
|
|
|


|
 |


