Student Content Assessments
Instrument 4: Student Content Assessment
for Mathematical Methods in Biology
Project: A First-Year Course: Mathematical Methods
in Biology
Iowa State University
Funding Source: NSF: Course and Curriculum
Development (DUE)
Purpose: To assess each student's ability
to read graphs of various mathematical functions
Administered To: Freshman and sophomore students
majoring in the biological sciences
Topics Covered:
- Content Specific Assessment: mathematics
Format/Length: 32 closed-ended multiple-choice
questions
DIRECTIONS
PLEASE DO NOT WRITE ON THE QUESTIONNAIRE. RECORD YOUR RESPONSES
ON THE BUBBLE SHEET PROVIDED.
In this test you will be given several situations and related
questions. You are simply to indicate which one of the possible
solution methods you would prefer to use.
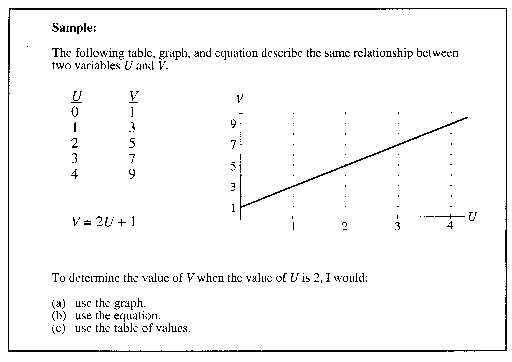
The test is grouped by these situations. Each situation
includes a table of values, a graph, and an equation. There
are five questions for each situation. For each question,
indicate how you would prefer to solve the problem,
that is by using the table, by using the graph, or by using
the equation. Each method is correct and will solve the problem.
You should choose the answer that has the most appeal or
is most satisfying to you.
Note that the order of choices varies from page to page.
There is no "right" or "wrong" item to choose.
DO NOT SOLVE THE PROBLEM. DO NOT CHANGE ANY OF YOUR CHOICES.
You may find that more one choice for each test item appeals
to you. However, select only one choice for
each question. Be sure to answer every question, even though
the decisions may be difficult to make.
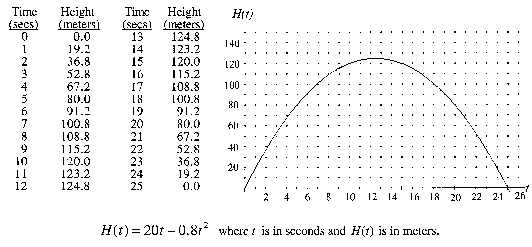
One of the first NASA astronauts to walk on the Moon smuggled
a golf club and ball onto the lunar lander. When he reached
the Moon's surface, he hit a long shot. The height of a golf
ball hit on the Moon is a function of its time in flight.
The relationship is given by the table, graph and equation
below.
- To find the time(s) at which the ball reaches a height
of 100 meters, I would:
- use the table of values.
- use the graph.
- use the equation.
- To determine the height of the ball after 10 seconds,
I would:
- use the table of values.
- use the graph.
- use the equation.
- To determine the time interval for which the ball is rising,
I would:
- use the table of values.
- use the graph.
- use the equation.
- To find the maximum height of the ball from the Moon's
surface, I would:
- use the table of values.
- use the graph.
- use the equation.
- To find when the ball's height is changing at less than
10 meters per second, I would:
- use the table of values.
- use the graph.
- use the equation.
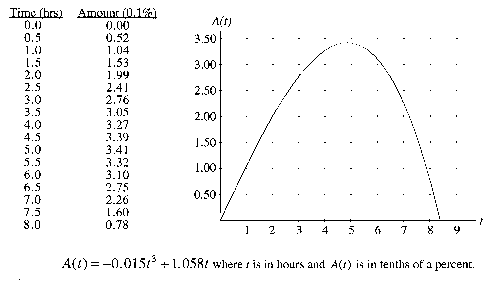
The approximate amount of alcohol concentration (in tenths
of a percent) in an average person's bloodstream after drinking
about 8 oz of 100 proof whiskey can be modeled by the table,
graph, and equation below.
- To determine the number of hours necessary for the alcohol
concetration to revert back to less than 1.0 tenths of a
percent concentration, I would:
- use the graph.
- use the equation.
- use the table of values.
- To determine when the maximum alcohol concentration occurs,
I would:
- use the graph.
- use the equation.
- use the table of values.
- To determine the maximum alcohol concentration, I would:
- use the graph.
- use the equation.
- use the table of values.
- The average amount of alcohol ingested into the blood
stream is based upon the area under the curve. To determine
if the area under the curve exceeds 20 square units, I would:
- use the graph.
- use the equation.
- use the table of values.
- In some countries a person is legally drunk if the blood
alcohol concentration exceeds 1.5 tenths of a percent. To
determine the number of hours for which an average person
is legally drunk, I would:
- use the graph.
- use the equation.
- use the table of values.
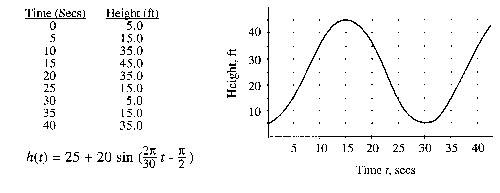
At last year's county fair, there was a Ferris wheel which
had a radius of 20 feet and sat 5 feet off the ground. The
height off the ground of a person riding the Ferris wheel
is represented by the table, graph, and equation below.
- To determine the time for a rider to travel one complete
revolution, I would:
- use the equation.
- use the table of values.
- use the graph.
- To determine a rider's height after 12.5 seconds, I would:
- use the equation.
- use the table of values.
- use the graph.
- To determine when during the first 45 seconds the height
of a rider is increasing, I would:
- use the equation.
- use the table of values.
- use the graph.
- To find if the rate at which the height changes exceeds
10 meters per second, I would:
- use the equation.
- use the table of values.
- use the graph.
- To determine when the height is changing the fastest,
I would:
- use the equation.
- use the table of values.
- use the graph.
- To find when a rider first reaches a height of 35 feet,
I would:
- use the equation.
- use the table of values.
- use the graph.
This situation is purely mathematical. A function F
is described by the table, graph, and equation below.
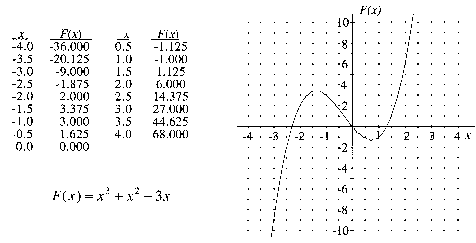
- To determine the value(s) of x for which F(x)=2,
I would:
- use the table of values.
- use the equation.
- use the graph.
- To find interval(s) where the function F(x) is
increasing, I would:
- use the table of values.
- use the equation.
- use the graph.
- To find the maximum value of F(x) for x
between -4 and 0, I would:
- use the table of values.
- use the equation.
- use the graph.
- To check if the area bounded by the curve and the x-axis
exceeds 6 square units, I would:
- use the table of values.
- use the equation.
- use the graph.
- To determine when the function F(x) is changing
at a rate greater than 5, I would:
- use the table of values.
- use the equation.
- use the graph.
This situation is purely mathematical. A function F
is described by the table, graph, and equation below.
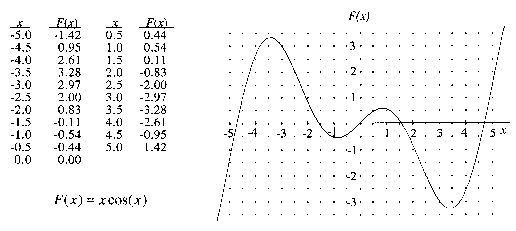
- To determine the first positive value of x for
which F(x) =1.5, I would:
- use the graph.
- use the table of values.
- use the equation.
- To determine where F(x) is a maximum on the
interval [-4, 4], I would:
- use the graph.
- use the table of values.
- use the equation.
- To find the maximum value of F on the interval
[-4, 4], I would:
- use the graph.
- use the table of values.
- use the equation.
- To determine if F(-x)= -F(x),
I would:
- use the graph.
- use the table of values.
- use the equation.
- To find when the function F(x) is changing
the fastest on the interval [-4, 4], I would:
- use the graph.
- use the table of values.
- use the equation.
This situation is purely mathematical. The functions F
and G are described by the table, graphs, and equations
below.
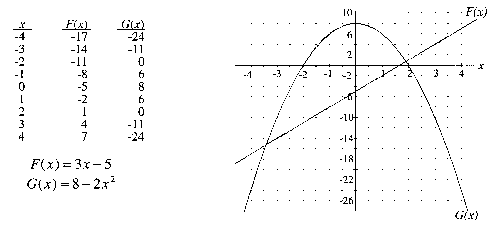
- To find the value of G(x) for which x
= 1.5, I would:
- use the equation.
- use the graph.
- use the table of values.
- To determine the interval(s) for which F(x)
is less than Gx), I would:
- use the equation.
- use the graph.
- use the table of values.
- To find when the values of G(x) are increasing,
I would:
- use the equation.
- use the graph.
- use the table of values.
- To determine where the rate at which G(x)
is changing is less than 10, I would:
- use the equation.
- use the graph.
- use the table of values.
- To determine the value(s) of x for which G(x)
is positive, I would:
- use the equation.
- use the graph.
- use the table of values.
- To find the value of G(x) when x=
-1, I would
- use the equation.
- use the graph.
- use the table of values.
IF YOU FINISH BEFORE TIME IS CALLED, CHECK THAT EACH PAGE
WAS COMPLETED AND THEN TURN YOUR TEST OVER.
DO NOT CHANGE ANY OF YOUR CHOICES.
|
 |

