| |
Excerpt 1
[Silicon Prairie Initiative for Robotics in Information Technology (SPIRIT) University of Nebraska, Lincoln]
|
|
Interpretations
& Conclusions:
Describes results of observing presentations of lesson features and appropriateness
|
On the final day of the summer workshop series for SPIRIT in 2007, thirty-two five-minute presentations were made by the teachers in attendance (some paired up to make joint presentations). Dr. Mike Timms observed these teachers as they presented, and recorded his observations. The subject of the presentations was the lesson ideas that they had developed throughout their time in the workshops, as represented on a poster that they presented. The development of ideas ranged from early conceptions to fairly well-developed ideas for lessons on particular topics. The lessons all involved the Tekbot ® in some way, often as method for running experiments or trials to gather data, and the range STEM subject coverage was fairly wide.
Approximately 47% of the lessons involved mathematics appropriate to the grade levels of the students to be taught. Examples of topics covered across the grades from elementary to high school include, counting in 5's and 10s, even and odd numbers, addition, subtraction, coordinate plane, plotting of data on graphs of various kinds, integers, decimals, scale, proportion, number line (positive and negative numbers), angles, triangles, polygons, scatter plots, equations, best fit lines, mean, median, mode, stem and leaf plots, linear equations, direct/joint/inverse variation, positive/negative correlation and equations for parabolas.
About 47% of the lessons involved science topics appropriate to the grade levels of the students to be taught. Examples of topics covered across the grades from elementary to high school include designing experiments, variables, hypotheses, measurement, estimation, data collection, data recording in tables, graphing of data, simple statistical analysis, speed equation, momentum, friction, mass, light, sound, Newtons' laws, Ohm's law metric units, unit conversions, living cells, electricity and magnetism, astronomy, space exploration, and torque.
About 31% of the lessons involved engineering to some degree. Some lesson involved building the Tekbot ®, while others involved students completing some parts of the robot after others (teachers or engineering students) have completed the bulk of the assembly. Engineering topics covered included electrical circuits, electronic components (resistors, capacitors, etc.), soldering, engineering design, the use of engineering notebooks, technical drawing (2D and 3D), and the use of CAD software.
A few of the projects involved some non-STEM subjects also, such as history/social science and writing (in mathematics). One lesson for high school was going to address STEM careers. In summary, there was a wide range of lesson ideas generated by the teachers at all grade levels from elementary through high school. |
| |
Excerpt 2
[Silicon Prairie Initiative for Robotics in Information Technology (SPIRIT), University of Nebraska, Lincoln]
|
|
Interpretation & Conclusion
Comparison of year 1 student test data to school and district scores. Student Criterion Referenced Test Results |
Student Criterion Referenced Test results: Although it is still relatively early in the SPIRIT project to try to examine the possible effects on students from the teacher training interventions, the project leadership is already working closely with the Omaha Public Schools to investigate possible patterns within the student criterion-referenced test scores of the students taught by the SPIRIT teachers. A total of 19 groupings of these mathematics and science test scores were examined and compared with school and district averages. Some groupings represented multiple classes of a teacher.
SPIRIT Student Criterion-Referenced Test Score Comparisons |
|
Group, Grade, N = (CRT Number) |
CRT SPIRIT |
CRT School |
SPIRIT above? |
CRT District |
SPIRIT above? |
Group 1: 5th, N=22 (Mathematics) |
89.4% |
92.3% |
Below |
88.9% |
Above |
Group 2: 5th, N=22 (Science) |
90.7% |
77.8% |
Above |
75.3% |
Above |
Group 3: 6th, N=14 (Math) |
85.7% |
78.0% |
Above |
75.3% |
Above |
Group 4: 6th, N=16 (Math) |
62.5% |
78.0% |
Below |
75.3% |
Below |
Group 5: 6th, N= 16 (Science) |
87.5% |
51.2% |
Above |
75.3% |
Above |
Group 6: 7th, N=74 (Science) |
78.8% |
68.6% |
Above |
68.6% |
Above |
Group 7: 7th, N=95 (Math) |
85.1% |
83.9% |
Above |
84.5% |
Above |
Group 8: 7th, N=26 (Math) |
93.4% |
83.9% |
Above |
84.5% |
Above |
Group 9: 7th, N=100 (Science) |
79.6% |
76.9% |
Above |
68.6% |
Above |
Group 10: 8th, N=76 (Math) |
87.5% |
86.1% |
Above |
84.5% |
Above |
Group 11: 8th, N=46 (Math) |
97.0% |
86.1% |
Above |
84.5% |
Above |
Group 12: 8th, N=79 (Math) |
89.4% |
86.1% |
Above |
84.5% |
Above |
Group 13: 8th, N=28 (Math) |
99.4% |
86.1% |
Above |
84.5% |
Above |
Group 14: 8th, N=14 (Math) |
94.9% |
86.1% |
Above |
84.5% |
Above |
Group 15: 8th, N=13 (Math) |
75.0% |
83.9% |
Below |
84.5% |
Below |
Group 16: 8th, N=11 (Math) |
57.7% |
83.9% |
Below |
84.5% |
Below |
Group 17: 8th, N=19 (Science) |
56.2% |
68.6% |
Below |
68.6% |
Below |
Group 18: 8th, N=118 (Science) |
78.8% |
76.9% |
Above |
68.6% |
Above |
Group 19: 8th, N=112 (Science) |
77.8% |
76.9% |
Above |
68.6% |
Above |
Initial comparisons of the SPIRIT-related criterion referenced test scores with the teacher-related school and district averages have been promising. Of the 19 groupings of students, represented by their teacher's participation in SPIRIT, a total of 14 groupings scored above their school averages on the related criterion referenced tests in mathematics and science, and a total of 15 groups scored above the district averages. Although this very limited evidence does not directly support possible cause and effect conclusions, it is an encouraging result, since many of these SPIRIT groupings are taken from some of the traditionally poorest performing schools in the Omaha Public School system. The SPIRIT leadership team and the OPS curriculum supervisors are now undertaking a more detailed analysis of this data (including demographic breakdowns), and the student CRT data analysis will be expanded in future reports.
|
|
| |
Excerpt 3
[Urban Ecology, Information Technology, and Inquiry Science for Students and Teachers, Boston College]
|
|
Interpretation & Conclusion
Table summarizes pre-post changes and significance levels of teachers' self reports of technology use and skills. |
IT Skills
Tables 2-4, below, display the results regarding respondents' general level of IT use , skill with classroom uses of IT , and skill with IT tools . As shown, participants experienced statistically significant levels of skill improvement in their classroom uses of IT and in their use of software tools specific to the UEI summer institute. Their general levels of IT use and their skill levels with PowerPoint and Excel did not increase significantly which was not surprising, both because their initial levels on these measures were already moderately high and because those skills were not specifically emphasized at the institute.
Table 2. General Level of IT Use (n=22)
Question 3: Please select the category that best indicates your overall level of use of information technology: |
Frequency |
|
Pre |
Post |
0 = Non-use |
0 |
0 |
1 = Orientation |
4 |
3 |
2 = Preparation |
2 |
1 |
3 = Mechanical Use |
5 |
5 |
4 = Routine |
2 |
1 |
5 = Refinement |
7 |
10 |
6 = Integration |
1 |
1 |
7 = Renewal |
1 |
1 |
Median |
3.5 |
5 |
|
| |
3 |
Positive differences |
6 |
Ties |
13 |
Total pairs |
22 |
p (two-tailed) |
.508 |
|
Table 3. Skills with Classroom Uses of IT (n=22)
Question 4: Please rate your level of skill in each of the following areas: |
|
Frequency |
a. Teaching students to use information technology |
Value |
Pre |
Post |
|
1 = Very Low |
1 |
0 |
|
2 |
10 |
5 |
|
3 |
6 |
8 |
|
4 |
5 |
8 |
|
5=Very High |
0 |
1 |
|
Median |
2.5 |
3 |
|
Negative differences |
2 |
Positive differences |
12 |
Ties |
8 |
Total pairs |
22 |
p (two-tailed) |
.013 |
|
b. Helping students to use information technology in class as part of a lesson |
Value |
Pre |
Post |
|
1=Very Low |
0 |
1 |
|
2 |
8 |
1 |
|
3 |
8 |
8 |
|
4 |
5 |
9 |
|
5 = Very High |
0 |
3 |
|
No response |
1 |
1 |
|
Median |
3 |
4 |
|
Negative differences |
0 |
Positive differences |
14 |
Ties |
6 |
Total pairs |
20* |
p (two-tailed) |
p = .000 |
|
c. Designing lessons that make use of information technology to teach science |
Value |
Pre |
Post |
|
1=Very Low |
4 |
2 |
|
2 |
9 |
4 |
|
3 |
5 |
7 |
|
4 |
2 |
6 |
|
5 = Very High |
2 |
2 |
|
No response |
0 |
1 |
|
Median |
2 |
3 |
|
Negative differences |
1 |
Positive differences |
10 |
Ties |
10 |
Total pairs |
21* |
p (two-tailed) |
p = .012 |
|
*The total number of pairs is less than the number of people in the sample because of missing data.
Table 4. Skills with IT Tools (n=22)
Question 5: Please rate your level of skill in each of the following tools: |
|
Frequency |
|
Value |
Pre |
Post |
Bioacoustic software |
1 = Very Low |
16 |
1 |
|
2 |
2 |
6 |
|
3 |
2 |
7 |
|
4 |
2 |
5 |
|
5=Very High |
0 |
3 |
|
Median |
1 |
3 |
|
Negative differences |
0 |
Positive differences |
16 |
Ties |
6 |
Total pairs |
22 |
p (two-tailed) |
.000 |
|
|
Value |
Pre |
Post |
Geographic information system (GIS) software |
1 = Very Low |
11 |
2 |
|
2 |
8 |
5 |
|
3 |
2 |
7 |
|
4 |
0 |
6 |
|
5=Very High |
1 |
2 |
|
Median |
1.5 |
3 |
|
Negative differences |
2 |
Positive differences |
18 |
Ties |
2 |
Total pairs |
22 |
p (two-tailed) |
.000 |
|
|
Value |
Pre |
Post |
Microsoft PowerPoint |
1 = Very Low |
1 |
0 |
|
2 |
2 |
1 |
|
3 |
8 |
6 |
|
4 |
5 |
9 |
|
5=Very High |
6 |
6 |
|
Median |
3.5 |
4 |
|
Negative differences |
1 |
Positive differences |
6 |
Ties |
15 |
Total pairs |
22 |
p (two-tailed) |
.125 |
|
|
Value |
Pre |
Post |
Microsoft Excel |
1 = Very Low |
1 |
0 |
|
2 |
5 |
14 |
|
3 |
7 |
5 |
|
4 |
3 |
8 |
|
5=Very High |
6 |
5 |
|
Median |
3 |
4 |
|
Negative differences |
1 |
Positive differences |
6 |
Ties |
15 |
Total pairs |
22 |
p (two-tailed) |
.125 |
|
|
|
| |
Excerpt 4
[Urban Ecology, Information Technology, and Inquiry Science for Students and Teachers, Boston College]
|
|
Interpretation & Conclusion
Table summarizes quantitative analyses and significance levels of average pre-post self-efficacy ratings by teachers. |
Self-Efficacy and Other Attitudes Regarding Career Education, Science Teaching, and Technology Use
As shown below in Table 10, participants reported statistically significant changes over the course of the summer institute in their:
- level of knowledge about how to guide students into STEM careers;
- self-efficacy in teaching science field investigations;
- belief in the usefulness of IT to engage students with scientific content;
- confidence about teaching students how to formulate explanations, models, and arguments;
- confidence about teaching students how to design and conduct scientific investigations.
The only construct for which the change was not statistically significant was
educators perception of the importance of their own role in providing STEM career
information to students. It should be noted that the pre-test mean scale score for
this construct was already high: 4.3818 out of 5. Thus due to ceiling effects, it
is unlikely that statistically significant change could occur or be detected. It is
also worth noting the lower standard deviation at post-test indicates less
variability in the participant responses and that the mean is a more accurate
indicator of any one particular participants response. At the pre-test there
was much more variability in how participants scored on all of these constructs.
Table 10. Self-Efficacy and Other Attitudes Regarding Career Education, Science Teaching, and Technology Use (n=22)
Scale Name |
Survey Item Numbers |
Pre-Test Scale Scores |
Post-Test Scale Scores |
t (df=21) |
|
|
M |
SD |
M |
SD |
Career Ed.: Ownership |
15, 22, 29, 35, 38 |
4.3818 |
.61073 |
4.5727 |
.51749 |
1.897 |
Career Ed.: Competency |
19, 32, 42, 44 |
3.8864 |
1.01690 |
4.3561 |
.54868 |
2.316* |
Self-Efficacy Teaching Field Investigations |
26, 36, 41 |
3.7955 |
1.10066 |
4.2803 |
.58052 |
2.179* |
Attitude: IT to Engage Students in Science Content |
12, 16, 21, 26, 31 |
4.0909 |
.75272 |
4.3818 |
.45318 |
2.727* |
Formulating Explanations, Models, and Arguments |
13, 18, 23, 28, 34, 39, 45 |
3.8896 |
1.04972 |
4.3247 |
.61117 |
2.462* |
Designing and Conducting Investigations |
11, 14, 17, 20, 24, 27, 30, 33, 37, 40, 43 |
3.7269 |
1.17475 |
4.3218 |
.60130 |
2.880** |
* p < .05
**p < .01
|
|
|
| |
Excerpt 5
[Mississippi Valley State University]
|
|
Interpretation & Conclusion
Presents goals, data sources and findings. |
Goal 1: Increase the Use of Information Technology in Science Education
To enhance present curricula through the implementation of technology based experiments which mirror the Mississippi Department of Education's science and mathematics framework for students in the grades 9-12 through hands-on-activities and various other style (auditory, visual, and kinesthetic).
Data Source: Interviews of administrative and project staff, handouts during campus visits, and evaluations.
Findings: The students had the opportunity to enhance their computer skills via the use laptop computers. Nine water quality parameters were performed using Vernier Logger-Pros attached to computer (temperature, pH, turbidity, total solids, dissolved oxygen, five-day biological oxygen demand, total phosphate, nitrates and fecal coliforms). Teachers were instructed how to analyze the collected data using Verneir Logger Pro 3 software and how these various parameters relate to each other as well as the overall water quality of the pond. Water samples were retrieved from the catfish ponds by the students and teachers during the catfish pond visits.
|
|
| |
Excerpt 6
[EcoScienceWorks (Foundation of Blood Research)]
|
|
Interpretation & Conclusion
Multiple representations of data: bar graph and tabular presentation |
Participating teachers were also asked to provide a self assessment of their own groups work on the curricular unit to which they were assigned. The rating scale was 1 = our group needs improvement to 5 = "our group did an excellent job". The results are found in Figures 9a and 9b.
Figure 9a
Teaching your Curricular Unit
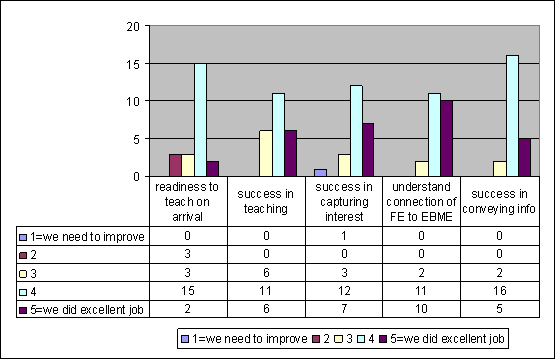 |
With respect to their readiness to teach their curricular unit after leaving Camp Kieve and arriving on Hog Island, 17 of the 23 teachers felt they were quite prepared; and six felt less prepared. The mean rating for the group was a 3.70 on a 5-point scale. With respect to their success in teaching their unit to students and teachers, the mean rating was 4.00; for success in capturing and maintaining students interest 4.14; in their understanding of the connection between EBME and the FE, they rated themselves as 4.35; for success in conveying the connection between EBME and the FE 3.91. (See Figure 9a above for frequencies.)
Figure 9b
Teaching your curricular unit (continued)
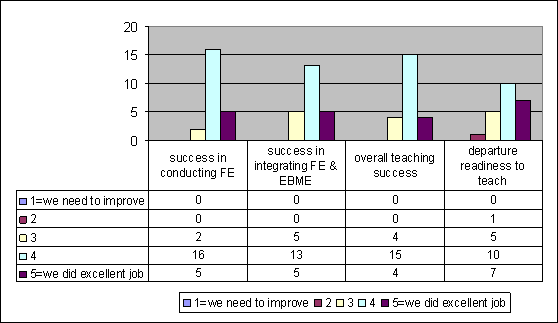 |
As shown in Figure 9b above, self assessments were quite high. For example, for the most part, teachers felt they did a good or excellent job in conducting the FE (0 - 4.13), and in integrating the FE and EBME (0 = 4.00). Overall, most teachers appeared to feel that their group had done a good or excellent job teaching the units and after piloting the units with students, they felt slightly more ready to teach them in the fall (0 = 4.00).
|
|
| |
Excerpt 7
[SRI Build IT]
|
|
Interpretations & Conclusions
Summarizes results of formative evaluation from year 1. |
In just twelve weeks, the girl participants, supported by their group
leaders and program coordinators, successfully accomplished Unit 1 of the
Build IT curriculum. All components of the curriculum were implemented and
the posters presented at Family Tech Night at EXPLORE and Muir represented
the breadth and depth of understanding about the design process developed by
the girls. From interviews and feedback forms collected from the group
leaders and program coordinators and observations of the girls in activity,
we were able to uncover many ways that the Build IT curriculum was working
and not working as it had been intended. Below is a summary of our
findings about how the first unit of Build IT was taken up by the
Girls Inc. programs at EXPLORE and Muir Middle Schools' All Stars programs.
|
|
| |
Excerpt 8
[SRI Build IT]
|
|
Interpretations & Conclusions
Describes year 1 learning outcomes observed by project staff. |
Preliminary Learning Outcomes for Girls
The group leaders, program staff and program manager were able to identify
key concepts and practices from the curriculum that they felt the girls had
mastered and appropriated to varying degrees. Below are a few of the skills,
language, understandings that the staff felt girls in general had
acquired from Unit 1:
- Took up the language of the design process. For example, the program coordinator at EXPLORE noted that the girls used design terms in a visit to the Exploratorium unrelated to the Build IT project.
- Learned the steps in the Design Process, to varying degrees of
understanding. Although girls appeared to have trouble understanding
that they have not yetcompleted the design cycle, we have seen evidence
that they understand many of the early steps. We observed a girl at Muir
who initially did not believe it possible to take into account the user
needs of 30 girls in designing a hangout room. However, by the end of the
session, in which the girls brainstormed ideas for such a room, this girl
admitted that it was at least sort of possible. During the performance
task at Muir, we observed girls taking into account user feedback to
iterate on their designs of a daycare room. At Family Tech Night at both
sites, girls' posters displayed the design process, and girls were
successful in articulating the steps to visitors.
- At EXPLORE, learned to brainstorm and understood that gathering user
needs was part of the design process. For example, girls gathered user needs
(primarilycomments from the principal) to complete their community project,
which was to design a mural for the school.
- At Muir, learned what sketching is and became comfortable creating
quick, imperfect drawings. However, sketching was more of a struggle at
EXPLORE because the girls were "perfectionists" and were not able to make
drawings to express an idea quickly.
|
|
| |
Excerpt 8
[SRI Build IT]
|
|
Offers recommendations for project revisions. |
Recommendations
Based on the Enduring Understanding and Learning Goals for Unit 1,
we make the following recommendations for revision of the curriculum:
- Continue to use the type of hands-on activities which the girls
preferred and which tended to engage the girls more fully in the
curriculum, such as building clay models in Perfect Hangout.
- Shorten some activities, especially Things That Fly.
- Continue to emphasize groupwork, which resulted in important learning outcomes for girls.
- Afford greater opportunities for girls to participate in reflections
and presentations of their designs in each activity, which we believe would
enhance the girls' understanding of why they are doing each activity and
how it relates to the larger Design Process concepts and goals of Build IT.
- Make more explicit the connection between the activities the girls
engage in with and the Design Process concepts. More consistency and
repetition of concepts, as well as explicit connections between activities,
are needed. In particular, girls appear to lack an understanding of the
later steps in the Design Process.
|
|
| |
Excerpt 9
[SRI Build IT]
|
|
Interpretations & Conclusions
Describes results of analyses comparing project participants responses related to one program with responses from a comparison group. |
II. Course-Taking Plans
One objective of Build IT is to increase participants plans to
enroll in high school computer and upper-level mathematics courses.
Descriptive results suggest that there was some change among Build IT
participants with respect to interest in high school computer courses
(Figure II.1). Notably, there was a substantial decline in the
proportion of Build IT participants who reported that they did not
plan to, or did not know whether they would take a computer course in
high school (left panel). Although this change did not result in an
increase in the 'yes' responses on the post-test, it did lead to a
17-point increase in the proportion of participants who
responded 'maybe'. By contrast, the comparison group increased
the 'no' response by 7-percentage points.
|
|
|

